Why I modeled a three-star kitchen like a factory
Why I built a digital twin of The French Laundry. A tasting-menu kitchen is high-mix, low-volume, just-in-time production with shared machines and perishable stock. That makes it a better test of a digital twin than a toy conveyor belt. Here is the mapping and the bar I set.
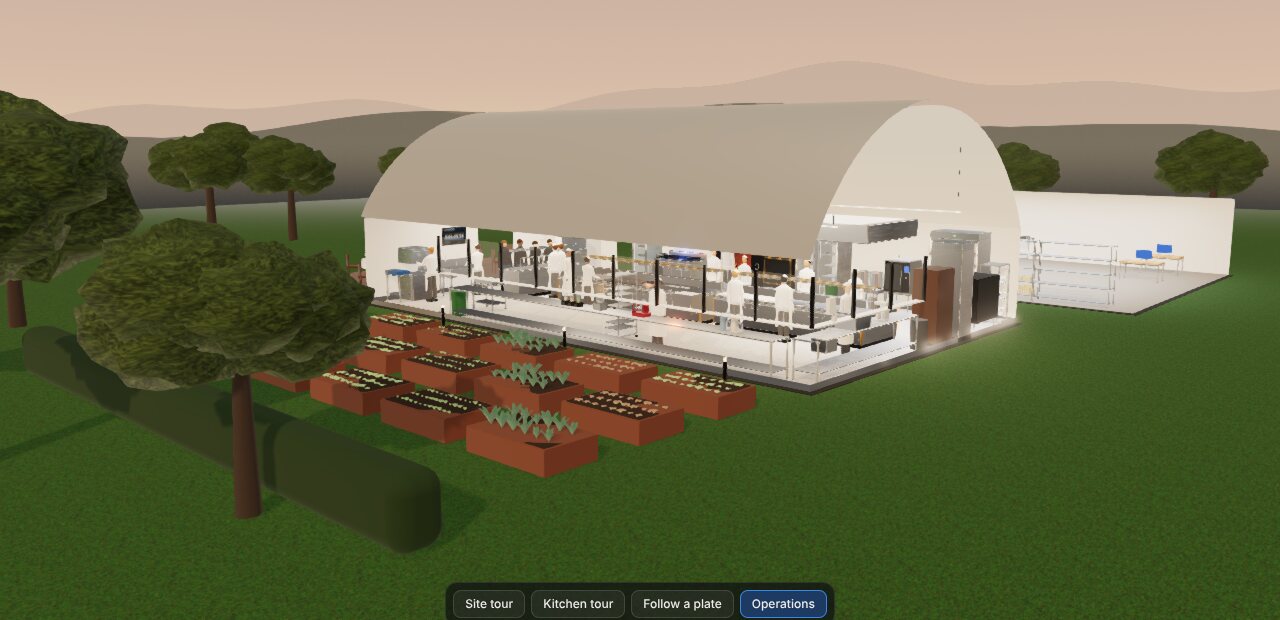
Most digital twin demos show one of two things: an abstract dashboard, or a conveyor belt moving identical boxes. Neither looks like a real operation. Real plants have dozens of product variants, machines shared between lines, operators with different skills, inventory that spoils, and customers with due dates. A demo that skips all of that does not tell a plant manager whether a twin can handle their problem.
A fine-dining kitchen has every one of those problems, in a space you can see end to end in one camera shot. The twin models The French Laundry, the three-star kitchen in Yountville, California.
The kitchen is already a factory
Here is how the concepts line up, and how the twin's data is organized:
| Kitchen | Factory |
|---|---|
| The French Laundry and its kitchen | Plant |
| Tasting menu, course choices, supplements | Product catalog, configure-to-order options |
| Covers booked tonight | Master production schedule (the build plan) |
| Ingredients | Purchased raw materials |
| Mise en place: stocks, sauces, doughs, portioned fish | Sub-assemblies and work in process |
| Plated courses | Finished goods |
| Recipe quantities | Bill of materials |
| Method, station, appliance, timings | Routing: operations with setup and run times |
| Stations: fish, meat, garde manger, pastry | Work centers |
| Ranges, combi ovens, hearth | Machines with parallel capacity |
| The brigade | Labor pool by skill, with shifts |
| The pass | Final inspection |
None of this is a metaphor stretched to fit. Expo firing a course early so every plate on a table finishes together is offset scheduling. A cook who can cover fish and garnish is a skills matrix. A dish that runs out and gets swapped is an engineering change under pressure. Once you see it, a dinner service reads like a production line with an unusually demanding customer.
Why it makes a better test
A twin earns trust by getting the hard cases right. A kitchen at full service is hard in exactly the ways that matter:
- High mix. Eleven courses with choices and supplements, 15 plated dishes, 38 sub-assemblies.
- Shared, constrained machines. A few combi ovens and one hearth serve every station.
- Skilled labor. Who can cook what is as much a constraint as the equipment.
- Perishable inventory. Prep made too early is waste. Prep made too late is a stockout at 8:30.
- Hard due dates. Guests notice a slow course within minutes.
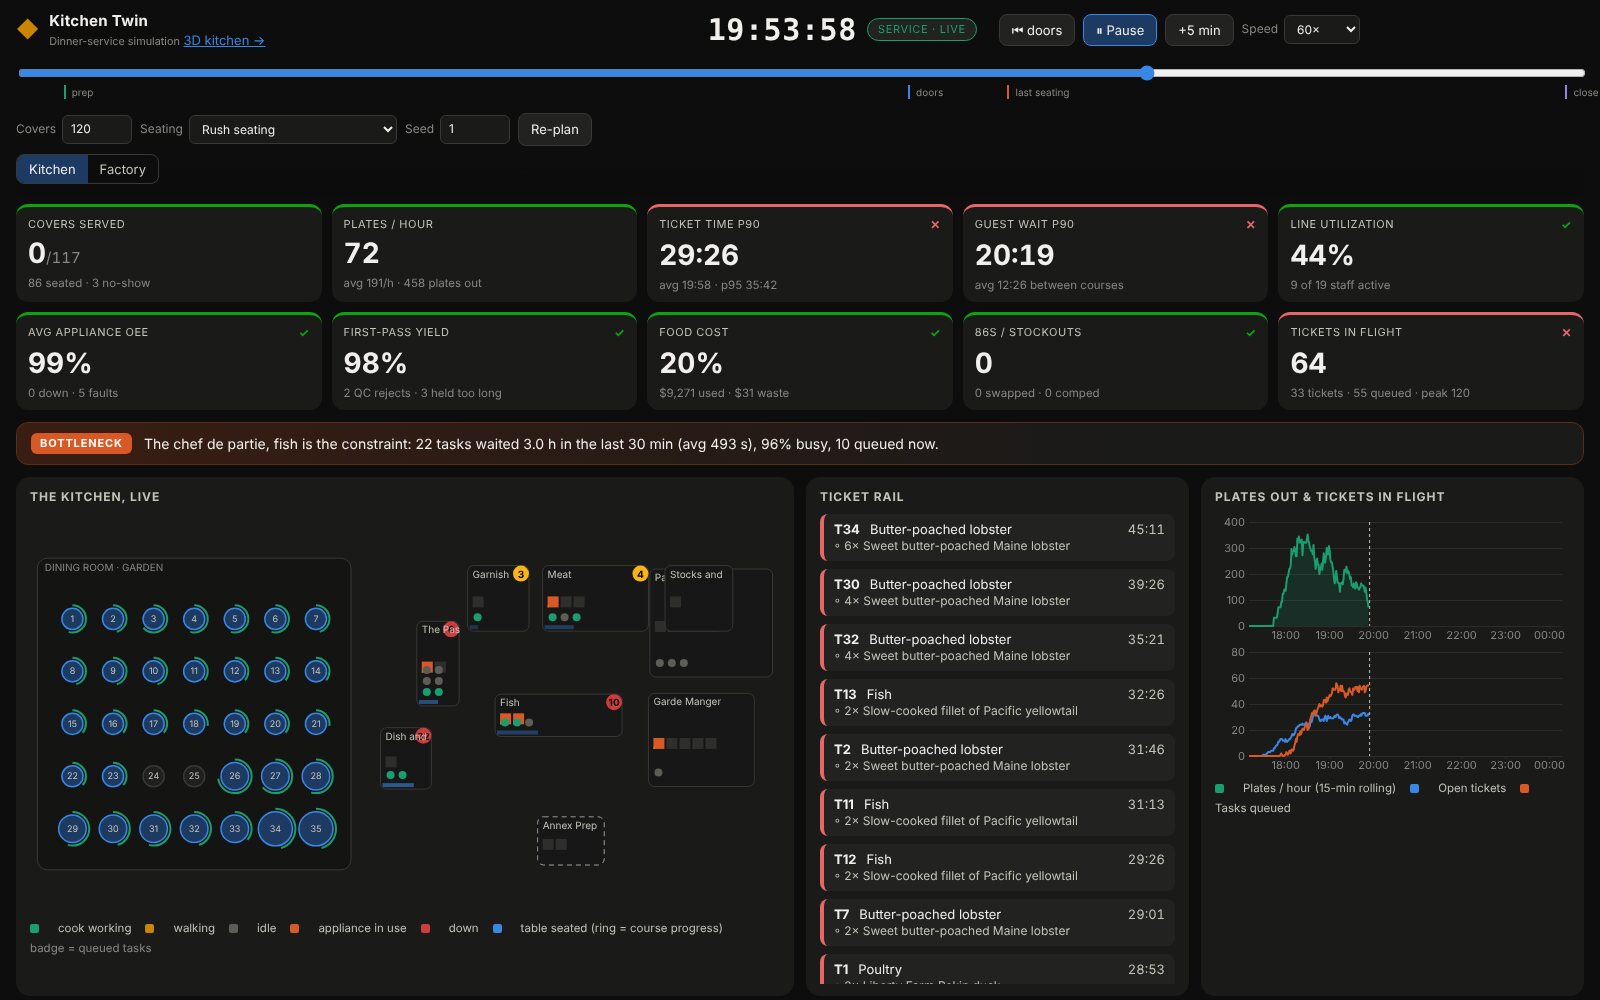
If the model can show why the fish station backs up at 120 covers, the same model can show why a weld cell backs up on Tuesdays.
The bar I set
I wrote the product brief before any code, as a press release and FAQ, so every decision could be checked against it. Four rules came out of it:
- The data is sourced. Every record cites a publication or is marked
est. The kitchen's size, its equipment schedule, the courses and several full recipes come from published sources. Brigade size, timings and layout positions are estimates, and the data says so. - The plan is computed, not scripted. Covers go through the bills of materials into plates, sub-assemblies and grams of each ingredient. Routings turn into minutes of work for each cook and machine.
- The service is simulated, not animated. What you see in 3D is the simulation's state, frame by frame.
- It is deterministic. The same covers, seating and seed replay the same night to the second. That is what lets a share link open the exact moment you were watching.
The other bar was practical. It had to open from a link, on a laptop or a phone, with no install and no login. So it runs entirely in the browser on GitHub Pages, and the 3D scene is generated from the data at load time, with no downloaded models or textures.
What you can do with it
Pick the covers and a seating pattern, then run the night. Double the covers. Take a cook off the line. Fail a combi oven at 8:15. Run the lobster 40% short. Then watch the bottleneck move, the ticket times climb and the dashboard explain why. Change something and run the same night again from the same seed, so the comparison is fair.
Part 2 goes into the data model and the MRP explosion that turns covers into a production plan.